.png)
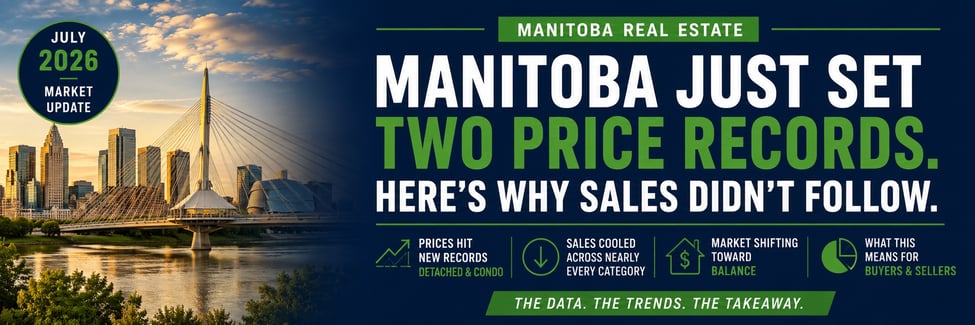
Manitoba Just Set Two Price Records. Here’s Why Sales Didn’t Follow.
Manitoba detached and condo prices both hit new July records — $454,264 and $290,522 — even as sales cooled across nearly every category. Here’s what’s actually driving the gap, and what it means depending on where you sit.
📍 Quick Snapshot — July 2026
In July 2026, Manitoba set new all-time July price records in both detached ($454,264) and condo ($290,522) homes, even as sales volume fell in nearly every category — a combination that points to a market shifting toward balance rather than one that’s overheating or cooling.
Manitoba detached and condo prices both hit new July records — $454,264 (detached, up 2.45% year-over-year) and $290,522 (condo, up 1.99%).
All MLS sales fell 8.78% year-over-year to 1,475 — but the average price held firm at $408,020, up 2.39%.
Condos saw the sharpest pullback of any category — sales down 21.43% — even as the average price still climbed to a new record.
Just over half of detached homes (53.89%) sold under list price — the over-list share dropped more than 7 points from June, from 44.83% to 37.67%.
Winnipeg city detached prices barely moved (-0.25%) even as the Manitoba-wide average climbed 2.45% — a real gap between the city and the province this month.
🔗 Jump to Section
- All MLS Manitoba — July 2026 Overview
- Detached Homes Across Manitoba — July 2026
- Where Is Inventory Sitting? Price Bands & Active Listings
- Sale Outcomes: Over, At, and Under List Price
- Winnipeg Detached — July 2026
- Condominiums — July 2026
- Residential Attached — Townhomes & Semi-Detached
- Surrounding Winnipeg Areas — July 2026
- Full Market Snapshot — July 2026
- What This Means for Buyers
- What This Means for Sellers
- July 2026 Manitoba Real Estate FAQ
- What We’re Watching in August 2026
Read the Full Video Transcript
All MLS Manitoba
Let’s start with the big picture. Across all property types in Manitoba, there were 1,475 sales in July — down 8.78% from the 1,617 sales we saw in July 2025, and about 1.21% below the five-year average for this month. The average price across all MLS sales came in at $408,020 — up 2.39% year-over-year, and 5.71% above the five-year average for July.
Now, “all MLS” bundles together every property type — but the vast majority of that number comes from three categories: Residential Detached made up 71.46% of all sales this month, Condominiums 12.68%, and Residential Attached homes 5.02%. So when I say “all MLS,” that’s mostly what’s baked in.
Active listings: 4,005, up 8.89% from July 2025. New listings — the homes that came onto the market this month — were down slightly, 1.54% below last July, at 2,234. It sounds like sales cooled off a bit this month while the shelf kept filling up — and that combination usually starts to shift the leverage in the room, even if it doesn’t show up in the price yet.
That shift shows up in something called the absorption rate — how many months it would take to sell through the current active inventory at this month’s pace of sales. Fewer months signals a seller’s market, more months signals a buyer’s market. This July, that works out to about 2.72 months — 4,005 active listings divided by 1,475 sales. Still seller’s market territory, but it’s moved up from earlier this summer, which tells you the pace has eased a little.
Detached Homes Across Manitoba
Single family detached is the biggest category, and it’s usually the best read on where the market’s really headed. Province-wide across Manitoba, there were 1,054 detached home sales in July — down 6.56% from the 1,128 sales we saw in July 2025, and just 0.64% below the five-year average. Essentially right on pace.
The average detached price this July: $454,264. That’s up 2.45% from a year ago, and 6.33% above the five-year average for this month — the highest July average this market has ever recorded, according to the board’s own numbers.
Active inventory sits at 1,898 homes, up 11.84% year-over-year, though still 4.21% below the five-year average — so more choice than last July, but not an oversupplied market by historical standards. New listings were down 3.67% from a year ago, at 1,419. It sounds like this is a market finding its footing rather than tipping hard one way — prices are still climbing, but the pace of new supply and the pace of sales are both a step slower than last year.
Year-to-date through July, detached sales sit at 5,967 — down 7% from the same period last year, and 2% below the five-year average. The year-to-date average price is $473,124, up 3% from last year and 8% above the five-year average. So fewer transactions overall this year, but the ones happening are at meaningfully higher prices.
Price Bands & List Price Outcomes
Let’s look at how homes are actually selling relative to asking price, because that tells you where the real negotiating power sits. In July, 37.67% of detached homes in Manitoba sold over their list price. 8.44% sold exactly at list. And 53.89% sold under list. It seems like the days of almost every home going over asking are cooling off a bit — in June, 44.83% of homes sold over list. That’s dropped more than seven points in a single month.
Looking at where the sales actually happened by price: the $400,000 to $499,999 range was the most active in July, with 257 sales — 24% of all detached sales. The $300,000 to $399,999 range was second, with 228 sales, or 22%. Put those two ranges together with everything in between — roughly $250,000 to $499,999 — and that band alone accounts for about 53.5% of all detached sales this month. That’s where most of this market actually lives.
On the inventory side, the $500,000 to $749,999 range has the most active listings right now, at 509 — though it’s worth noting that’s a wider $250,000 band than most of the others, so some of that size is just math, not necessarily softness at that price point specifically.
Winnipeg Detached
Now, if we zoom into the City of Winnipeg specifically — separate from the province-wide numbers — the story shifts a bit. Active listings in the city: 855, up 11.18% year-over-year, though still 7.27% below the five-year average. Sales: 665, down 7.64% from last July, and 2.35% below the five-year average. Average price: $460,114 — essentially flat, down just 0.25% from a year ago, but still 4.48% above the five-year average.
The top neighbourhoods for detached sales in Winnipeg this July were Waverley West, followed by West Kildonan. It sounds like the city itself is behaving a little differently than the province as a whole this month — Manitoba-wide prices are still climbing at a healthy clip, but inside Winnipeg specifically, prices barely moved. That’s worth knowing if you’re comparing your own neighbourhood to the province-wide headline. Outside Winnipeg, the Steinbach area saw the most detached sales in July, followed by Morden/Winkler.
On the high end, there were 21 detached homes sold at $1 million or more in July, with the top sale over $2 million. That’s actually one more luxury sale than July of last year, even though the very top sale price was a bit lower than last year’s $2.5-million-plus peak.
Condominiums
Condos told a different story this month. 187 condo sales across Manitoba in July — down 21.43% from July 2025, and 11.63% below the five-year average. That’s the softest category this month by a wide margin. Despite the drop in sales, the average condo price actually climbed to $290,522 — up 1.99% year-over-year and 4.80% above the five-year average, a new July record. Active listings were nearly flat, up just 1.28%, at 474. It seems like fewer condo buyers were active in July, but the ones who did buy weren’t finding much room to negotiate on price — that’s not the pattern you’d expect from a slower month, and it’s worth watching.
Residential Attached
Residential attached — your townhomes and semi-detached properties — moved in the opposite direction on supply. Active listings jumped 19.76% year-over-year to 303, and they’re now running 12.22% above the five-year average. Sales were down 8.77% from last July, at 104. But the average price rose 6.68%, to $399,506 — 12.37% above the five-year average, and the largest year-over-year price increase of any category we’ve covered today. It sounds like buyers are showing up for attached homes and paying up for the right ones, even with more inventory to choose from — that’s a category worth watching if you’re on the fence.
Surrounding Areas
Zooming out to the communities just outside Winnipeg proper — Oakbank, RM of Springfield, East St. Paul, West St. Paul, St. Andrews, Headingley, and Oakbluff, combined — the average sale price over the trailing 12 months sits at $585,824, up from $560,181 a year ago. That’s a 4.58% increase. Sales activity in these communities is also up — 137 sales compared to 124 a year ago, a 10.48% increase. It seems like buyers who want more space or a bit more distance from the city are still showing up in numbers — and paying more to get it.
What the Data Shows
So here’s what I’d pull out of July, depending on where you sit. If you’re selling: Manitoba detached and condo prices both just set new July records — $454,264 and $290,522. If you’re pricing at what the market’s actually paying, you’re still in a strong position. But listings are up 11.84% province-wide, and attached homes posted the biggest price jump of any category at 6.68% — so how you present and price matters more than it did a year ago. This isn’t a market where every listing sells itself anymore.
If you’re buying: you genuinely have more to choose from than a year ago — active listings climbed across every category, attached homes up 19.76% year-over-year. Sales activity cooled almost everywhere, which usually means a little more room to negotiate. Condos in particular saw the sharpest pullback in sales, down 21.43%, which is worth a look if affordability is what you’re solving for.
And the big picture: this is a market finding a bit more balance. Prices up, sales down, inventory rising — that’s the classic signature of a shift, not a crash and not a boom. One more thing worth knowing: Winnipeg’s own detached numbers moved differently than Manitoba’s as a whole this month — city prices were down just 0.25%, essentially flat, while the province climbed 2.45%. If you’re comparing your own street to the province-wide headline, that gap matters.
July 2026 Winnipeg & Manitoba Housing Market Overview
July 2026 gave Manitoba a genuinely unusual combination: brand-new July price records in two categories — detached and condo — while sales volume softened almost everywhere. Records and softer sales don’t normally show up in the same month. When they do, it’s worth slowing down and looking at what’s actually driving each side.
The absorption rate of 2.72 months keeps Manitoba in seller’s market territory. However, that number has moved up from earlier this summer, and the share of detached homes selling over list price dropped more than 7 points in a single month — from 44.83% in June to 37.67% in July. The direction of travel is toward balance, even if we’re not there yet.
This update covers the full Manitoba picture, narrows into Winnipeg specifically, then covers condos, attached homes, and surrounding communities. If you’re also tracking the Interlake region, a separate July 2026 Interlake Real Estate Market Update covers Selkirk, Gimli, and surrounding communities in detail.
📊 All MLS Manitoba — July 2026 Overview
- Total sales: 1,475 (-8.78% from July 2025)
- Average sale price: $408,020 (+2.39% vs July 2025)
- Active listings: 4,005 (+8.89% vs July 2025)
- New listings: 2,234 (-1.54% vs July 2025)
- Absorption rate: 2.72 months (sellers market, easing) — the number of months it would take to sell through current active inventory at this month’s pace of sales; fewer months signals a seller’s market, more months signals a buyer’s market
Across all property types in Manitoba, July saw 1,475 residential sales — down 8.78% from the 1,617 sales recorded in July 2025, and about 1.21% below the five-year average for this month. The average sale price came in at $408,020, up 2.39% year-over-year and 5.71% above the five-year average.
“All MLS” bundles together every property type — but the vast majority of that number comes from three categories: Residential Detached made up 71.46% of all sales this month, Condominiums 12.68%, and Residential Attached homes 5.02%. So when this update says “all MLS,” that’s mostly what’s baked in.
Active listings sit at 4,005, up 8.89% from July 2025. New listings — the homes that came onto the market this month — were down slightly, 1.54% below last July, at 2,234. Sales cooled off a bit this month while the shelf kept filling up, and that combination usually starts to shift the leverage in the room, even before it shows up in the price.
What this means: At 2.72 months of absorption, Manitoba is still solidly in seller’s market territory — but the pace has eased from earlier this summer, and that’s the number worth watching heading into fall.
🏡 Detached Homes Across Manitoba — July 2026
- Sales: 1,054 (-6.56% from July 2025)
- Average sale price: $454,264 — a new July record (+2.45% vs July 2025)
- Active listings: 1,898 (+11.84% vs July 2025)
- New listings: 1,419 (-3.67% vs July 2025)
- YTD sales: 5,967 (-7%) | YTD average: $473,124 (+3%)
Single family detached is the largest category and the one that tells you the most about where the market is heading. Province-wide across Manitoba, there were 1,054 detached sales in July — down 6.56% from 1,128 a year ago, and just 0.64% below the five-year average. Essentially right on pace.
The average detached price this July, $454,264, is up 2.45% from a year ago and 6.33% above the five-year average — the highest July average this market has ever recorded, according to the board’s own numbers.
Active inventory sits at 1,898 homes, up 11.84% year-over-year, though still 4.21% below the five-year average — more choice than last July, but not an oversupplied market by historical standards. New listings were down 3.67% from a year ago, at 1,419. Year-to-date through July, detached sales sit at 5,967, down 7% from the same period last year and 2% below the five-year average. The year-to-date average price is $473,124, up 3% from last year and 8% above the five-year average — fewer transactions overall this year, but the ones happening are at meaningfully higher prices.
What this means: A home priced correctly and presented well is still setting records in July. However, rising supply means an overpriced home has more competition to stand out against than it did a year ago. For more on how buyers actually evaluate your asking price, see How Winnipeg Buyers Actually Use Your List Price.
📊 Where Is Inventory Sitting? Price Bands & Active Listings
The price band breakdown shows where most buyer and seller activity is actually concentrated.
Most active sales by price range (July 2026):
- $400,000–$499,999: 257 sales (24% of all detached sales)
- $300,000–$399,999: 228 sales (22% of all detached sales)
Combined, that roughly $250,000 to $499,999 window accounts for about 53.5% of all Manitoba detached home sales in July. That’s where most of the competition, most of the buyer activity, and most of the decision-making is happening.
On the active inventory side, the $500,000–$749,999 bracket holds the most active listings, at 509. That band spans a $250,000 range — a wider band than most of the others — so some of that size is just math, not necessarily softness at that price point specifically.
What this shows: If you’re buying or selling between $250,000 and $499,999, you’re in the most active part of the market — more competition for buyers, more exposure for sellers, and more comparable data to work from.
🏷️ Sale Outcomes: Over, At, and Under List Price
- 37.67% of detached homes sold over asking price
- 8.44% sold at asking price
- 53.89% sold below asking price
For context, in June 2026 it was 44.83% over asking. The share of homes selling above list has dropped more than 7 points in a single month — meaning buyers found meaningfully more room to negotiate in July than they had just one month earlier.
That said, more than a third of detached homes are still going above asking. Competition hasn’t disappeared — it’s shifted. The homes that are well-priced and well-presented are still attracting strong interest. The ones that aren’t are increasingly negotiating from a position that favours the buyer.
What this means: Both negotiation and competition are happening simultaneously — which home and which price point determines the experience. If you’re in the $400,000–$499,999 range and priced right, expect competition. Above that, buyers have more room to breathe. For sellers wondering how the first days on market shape everything that follows, see The First 7–21 Days.
🌆 Winnipeg Detached — July 2026
- Sales: 665 (-7.64% vs July 2025)
- Average sale price: $460,114 (essentially flat, -0.25% vs July 2025)
- vs. 5-year average: current prices are up 4.48%
- Active listings: 855 (+11.18% vs July 2025)
- vs. 5-year July average: still running 7.27% below historical norm
Inside Winnipeg, the story shifts from the province-wide numbers. Active listings sit at 855, up 11.18% year-over-year, though still 7.27% below the five-year average. Sales came in at 665, down 7.64% from last July and 2.35% below the five-year average. Average price: $460,114 — essentially flat, down just 0.25% from a year ago, but still 4.48% above the five-year average.
The top neighbourhoods for detached sales in Winnipeg this July were Waverley West, followed by West Kildonan. Outside Winnipeg, the Steinbach area saw the most detached sales in July, followed by Morden/Winkler.
On the high end, there were 21 detached homes sold at $1 million or more in July, with the top sale over $2 million — one more luxury sale than July of last year, even though the very top sale price was a bit lower than last year’s $2.5-million-plus peak.
What this means: The city itself is behaving a little differently than the province as a whole this month — Manitoba-wide prices are still climbing at a healthy clip, but inside Winnipeg specifically, prices barely moved. That’s worth knowing if you’re comparing your own neighbourhood to the province-wide headline.
👉 Free Guide: Buying and Selling at the Same Time
If you’re thinking about selling your Winnipeg home and buying another, this guide walks through the three moving parts and how to sequence them without getting caught in between.
🏢 Condominiums — July 2026
- Sales: 187 (-21.43% vs July 2025)
- Average sale price: $290,522 — a new July record (+1.99% vs July 2025)
- Active listings: 474 (+1.28% vs July 2025, essentially flat)
- vs. 5-year average: sales are 11.63% below, price is 4.80% above
Condos told a different story this month — the softest category by a wide margin. 187 condo sales across Manitoba in July is down 21.43% from July 2025, and 11.63% below the five-year average.
Despite the drop in sales, the average condo price actually climbed to $290,522, a new July record, up 1.99% year-over-year and 4.80% above the five-year average. Active listings were nearly flat, up just 1.28%, at 474.
What this means: Fewer condo buyers were active in July, but the ones who did buy weren’t finding much room to negotiate on price — that’s not the pattern you’d expect from a slower month, and it’s worth watching heading into fall.
👉 Free Guide: First-Time Home Buyer Guide
If you’re entering the market for the first time, this guide covers what to expect from pre-approval through possession — including how to evaluate condos versus attached homes at your price point.
🏘️ Residential Attached — Townhomes & Semi-Detached
- Sales: 104 (-8.77% vs July 2025)
- Average sale price: $399,506 (+6.68% vs July 2025 — the biggest price gain of any category)
- Active listings: 303 (+19.76% vs July 2025)
- vs. 5-year average: listings are 12.22% above, price is 12.37% above
Residential attached moved in the opposite direction on supply from condos. Active listings jumped 19.76% year-over-year to 303, now running 12.22% above the five-year average. Sales were down 8.77% from last July, at 104. But the average price rose 6.68%, to $399,506 — 12.37% above the five-year average, and the largest year-over-year price increase of any category this month.
What this means: Demand for attached homes is concentrated and competitive, even as more inventory enters the segment. Buyers priced out of detached homes are finding their way here, and that demand is holding prices up even as selection improves.
🚗 Surrounding Winnipeg Areas — July 2026
- Sales (trailing 12 months): 137 (+10.48% vs prior 12 months)
- Average sale price (trailing 12 months): $585,824 (+4.58% vs prior 12 months)
Outside Winnipeg city limits — Oakbank, RM of Springfield, East St. Paul, West St. Paul, St. Andrews, Headingley, and Oakbluff — the average sale price over the trailing 12 months sits at $585,824, up from $560,181 a year ago, a 4.58% increase. Sales activity in these communities is also up, 137 compared to 124 a year ago, a 10.48% increase.
At $585,824, the surrounding areas average sits well above both the Manitoba-wide detached average ($454,264) and the Winnipeg city average ($460,114) — a premium of over $125,000 above the city, holding firm even as buyers pay more to get it.
What this means: Buyers who want more space or a bit more distance from the city are still showing up in numbers — and paying more to get it. For Selkirk, Gimli, Stonewall, and surrounding Interlake communities, the full breakdown is in the July 2026 Interlake Real Estate Market Update.
📊 Full Market Snapshot — July 2026
- All MLS® Manitoba: 1,475 sales | $408,020 avg price (+2.39%)
- Detached (Manitoba): 1,054 sales | $454,264 avg price (+2.45%, new July record)
- Detached (Winnipeg): 665 sales | $460,114 avg price (-0.25%, essentially flat)
- Condominiums: 187 sales | $290,522 avg price (+1.99%, new July record)
- Residential Attached: 104 sales | $399,506 avg price (+6.68%)
- Surrounding Areas (trailing 12 months): 137 sales | $585,824 avg price (+4.58%)
Two records, softer sales in almost every category, and a real gap between how the city and the province each moved this month. The market isn’t retreating — it’s recalibrating.
🔑 What This Means for Buyers
You genuinely have more to choose from than a year ago — active listings climbed across every category, with attached homes up 19.76% year-over-year and detached up 11.84%. Sales activity cooled almost everywhere, which usually means a little more room to negotiate.
Detached competition is still real — 37.67% of homes sold over asking price in July. However, that’s down from 44.83% just one month earlier, and 53.89% of homes sold under list. If you’ve been waiting for the market to hand you a clearer buying signal — more inventory, softer sales, less competition on offers — July is arguably that signal for several categories.
Condos in particular saw the sharpest pullback in sales, down 21.43%, which is worth a look if affordability is what you’re solving for — though the price itself hasn’t softened to match, so don’t expect a discount just because sales slowed.
And the city-versus-province gap matters here too: Winnipeg detached prices were essentially flat (-0.25%) this month even as the provincial average climbed 2.45%. If you’re shopping inside the city specifically, the headline provincial number may be overstating what you’ll actually see on your own street.
It seems like the buyers doing well right now are the ones who came prepared — pre-approved, clear on their criteria, and ready to act on the right home rather than waiting for a market-wide signal that may not arrive evenly across every category.
🧭 What This Means for Sellers
The fundamentals are still in your favour. Manitoba detached and condo prices both just set new July records — $454,264 and $290,522. If you’re pricing at what the market’s actually paying, you’re still in a strong position.
However, listings are up 11.84% province-wide for detached homes, and attached homes posted the biggest price jump of any category at 6.68% — so how you present and price matters more than it did a year ago. This isn’t a market where every listing sells itself anymore. The over-list share dropped more than 7 points in a single month, from 44.83% in June to 37.67% in July, which tells you buyers have more to compare you against than they did just weeks ago.
If you’ve been putting off listing because you’re worried the market’s cooled too much to get a good price, that’s not really what July’s numbers show. What’s changed is that buyers have more to compare you against — not that they’re paying less.
If you’re selling in Winnipeg specifically, know that city prices moved differently than the province this month — essentially flat at -0.25%, versus the province’s 2.45% climb. Pricing off the provincial headline instead of your own neighbourhood’s actual comparables is a real risk right now.
It sounds like sellers doing well right now are treating price and presentation as a deliberate strategy — not assuming a record-setting month means every listing sells itself.
👉 Free Guide: Downsizing in Winnipeg & Manitoba
If you’re thinking about rightsizing your home in the months ahead, this guide covers how to evaluate your timing, what to expect from the process, and how to sequence your move with confidence.
❓ July 2026 Manitoba Real Estate FAQ
Why did Manitoba home prices hit a record while sales dropped in July 2026?
Manitoba detached and condo prices both set new July records — $454,264 and $290,522 — even as sales fell 8.78% across all property types. That combination usually means the buyers who are active are paying full value for well-priced homes, while overall buyer traffic has thinned out. It’s not a contradiction — it’s a market where fewer transactions are happening, but the ones that close are at genuinely higher prices.
Is Winnipeg still a seller’s market in July 2026?
Yes, but a more moderate one than earlier this summer. Manitoba’s absorption rate of 2.72 months keeps the province in seller’s market territory, and 37.67% of detached homes still sold over asking. However, that’s down from 44.83% in June — more than a 7-point drop in one month — so the pace has clearly eased even though sellers still hold the advantage overall.
Why did Winnipeg city detached prices barely move while the Manitoba average kept climbing?
Winnipeg city detached prices were essentially flat in July, down just 0.25% year-over-year, while the Manitoba-wide detached average climbed 2.45%. That gap usually means the province-wide price growth is being driven more by activity outside the city — surrounding communities and other regions — than by the city itself. If you’re comparing your own Winnipeg street to the provincial headline, that number can be misleading.
Which category had the softest market in July 2026?
Condominiums, by a wide margin. Sales fell 21.43% year-over-year — the steepest decline of any category — even though the average price still climbed to a new July record of $290,522. That combination of falling sales and rising price is unusual and worth watching into the fall.
Which category had the strongest price growth in July 2026?
Residential attached homes, up 6.68% year-over-year to an average of $399,506 — the largest price increase of any category this month, even as active listings in that segment jumped nearly 20%.
🔍 What We’re Watching in August 2026
- Whether the over-list share keeps dropping — a 7-point single-month move from 44.83% to 37.67% is significant; August will show whether that’s the start of a trend or a one-month variance
- The Winnipeg-versus-Manitoba price gap — city prices were essentially flat this month while the province climbed 2.45%; watching whether that gap narrows or widens into fall
- Condo sales — down 21.43% in July, the softest reading of any category; watching whether that’s a genuine slowdown or a one-month dip against a strong 2025 comparison
- Attached home inventory — up 19.76% in July; watching whether buyers absorb that new supply or whether the segment’s strong price growth starts to soften
- Absorption rate — at 2.72 months and rising from earlier this summer; another month of upward movement would be a clearer signal the market is genuinely shifting toward balance
None of these are predictions — they’re the places in the data where small changes tend to have the most visible impact on how the market feels for buyers and sellers over the next 30 to 60 days.
Justin Zinkowski
Realtor® | Royal LePage Prime Real Estate
Serving Winnipeg, the Interlake, and surrounding Manitoba communities, Justin specializes in helping homeowners understand local market conditions clearly before making a move.
Data & Accuracy Notice: Statistics sourced from the Winnipeg Regional Real Estate Board (WRREB) and reflect MLS activity through July 2026. Data was compiled prior to the publication of this post and is accurate as of the date of compilation. Real estate markets move quickly — for the most current information on your specific situation, reach out directly.