.png)
📌 Quick Snapshot — March 2026
Detached home prices across the Interlake came down in March compared to last year, while sales activity remained relatively steady in lower volumes.
Interlake-wide detached activity: 24 sales with an median sale price of $305,000.
Homes are still selling close to list price, with a 98.7% sale-to-list ratio, showing buyers are active but more selective.
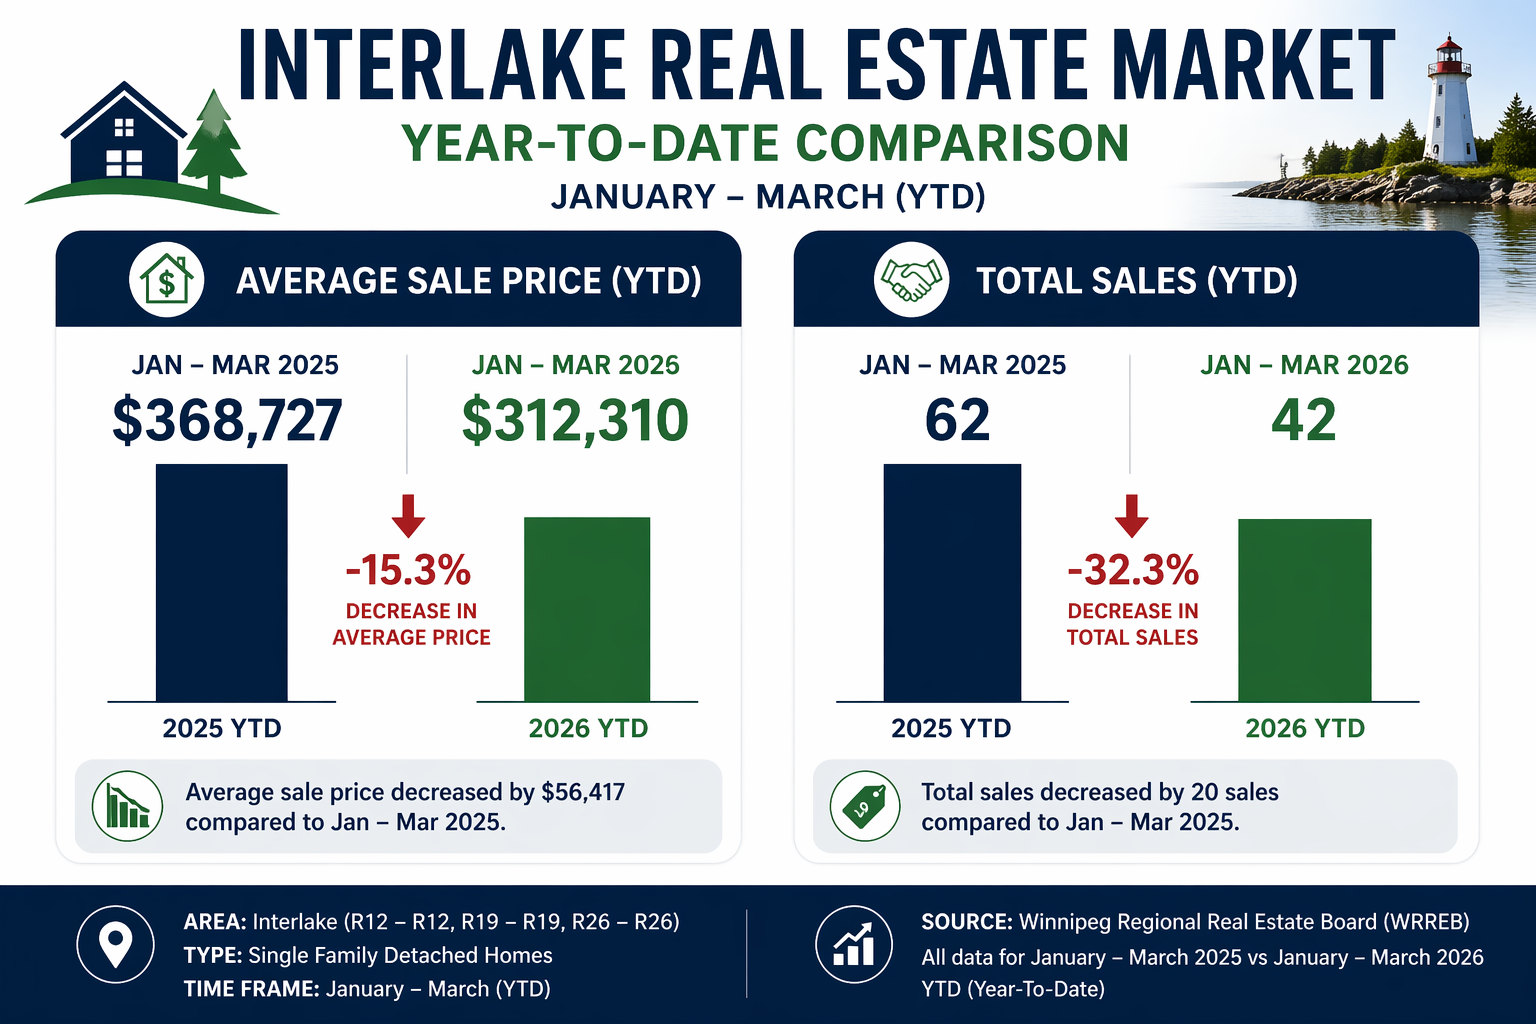
Different Interlake areas are behaving differently, which is why looking at Q1 (January–March) trends gives a clearer picture than one month alone.
🔗 Jump to Section
- Interlake Detached Market – March 2026
- Selkirk Market (Q1 Trend)
- Gimli Area Market (Q1 Trend)
- South Interlake Market (Q1 Trend)
- Market Snapshot
- How This Market Affects Sellers
- FAQ
- What We’re Watching Next Month
- Optional Next Steps
- About the Author
- Source
March 2026 Interlake Real Estate Market Overview
The March 2026 Interlake real estate market shows a shift compared to last year, with fewer high-priced sales pulling down the overall average. At the same time, homes are still selling relatively quickly and close to list price.
Because Interlake markets tend to have lower monthly sales volume, this update looks at both March data and Q1 trends to give a clearer picture of what’s actually happening across different communities.
🏡 Interlake Detached Market — March 2026
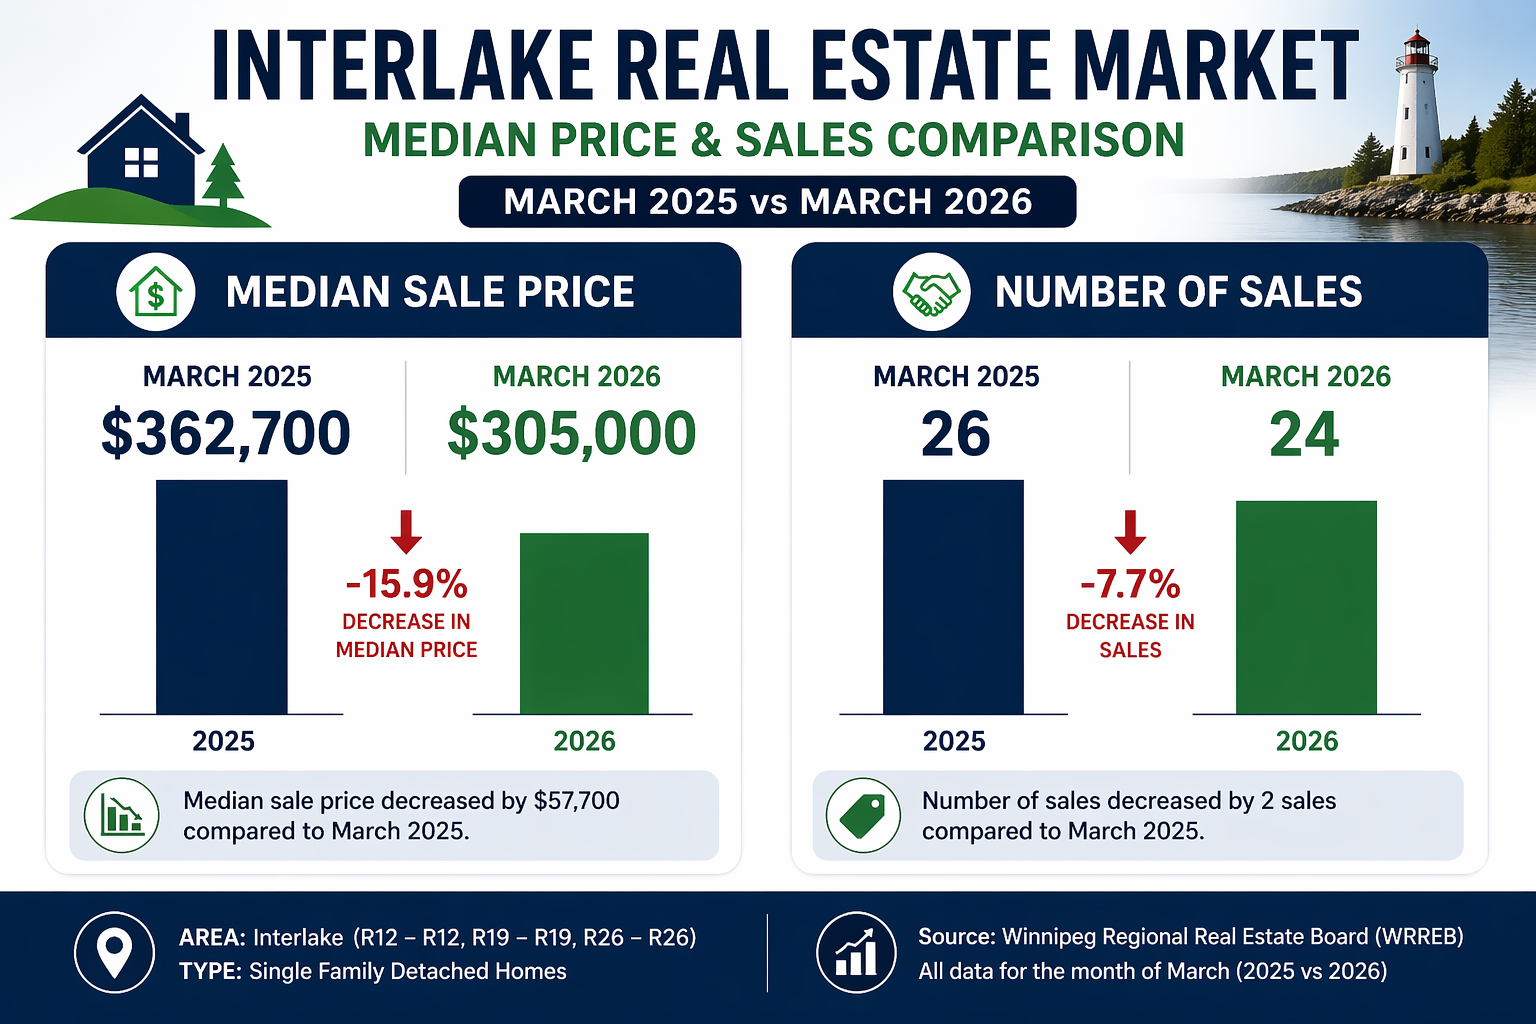
Number of sales: 24
(Compared to 26 sales in March 2025)Median sale price: $305,000
(Down from $362,700 in March 2025)Days on market: 34
(Up from 28 days last year)Sale-to-list ratio: 98.7%
What this means: If you’re looking at the headline numbers, it might feel like the market has softened — and in some ways it has. But homes are still selling close to list price, which tells us buyers are still active. They’re just being more selective about what they move on.
🏘️ Selkirk Market — Q1 2026 vs 2025
Q1 2026: 23 sales | Avg price ~$358,000
Q1 2025: 32 sales | Avg price ~$363,000
Sales are down compared to last year, but pricing has remained relatively stable. That suggests demand hasn’t disappeared — it’s just more selective.
🌊 Gimli Area Market — Q1 2026 vs 2025
Q1 2026: 11 sales | Avg price ~$323,000
Q1 2025: 20 sales | Avg price ~$308,000
Gimli is showing lower sales activity, but prices have held steady and even increased slightly. That points to fewer transactions, not weaker demand.
🌾 South Interlake — Q1 2026 vs 2025
Q1 2026: 12 sales | Avg price ~$439,000
Q1 2025: 23 sales | Avg price ~$465,000
This area is showing both lower sales and softer pricing, making it one of the more noticeable shifts in the Interlake this month.
📊 Market Snapshot — Interlake (March 2026)
🧭 How This Market Affects Sellers
Prices were pulled down overall,
but that came from how different areas performed — not a single market shift.
Selkirk held, Gimli slowed with stable pricing,
and South Interlake softened.
❓ March 2026 Interlake Market FAQ
Is the Interlake market slowing down?
Some areas are seeing fewer sales, but homes are still selling close to list price, which suggests buyers are still active.
Why do prices look lower this month?
Lower sales volume can shift the average quickly in smaller markets. That’s why Q1 trends are more reliable than one month alone.
Is this a good time to sell?
It depends on your area and price range. Some segments are still competitive, while others require more strategic pricing.
🔍 What We’re Watching Next Month
- Whether new spring listings increase inventory
- If pricing stabilizes across more Interlake areas
- How buyer activity responds in lower-volume communities
- Whether Selkirk continues holding steady compared to other areas
✅ Optional Next Steps
👉 Find your home value
👉 20 Tips for Downsizing
✍️ About the Author
Justin Zinkowski
Realtor® | Royal LePage Prime Real Estate
Serving Winnipeg and the Interlake, Justin focuses on helping homeowners understand their local market before making a move.
📄 Source
All data sourced from Winnipeg Regional Real Estate Board (WRREB) and verified MLS statistics for March 2026.